By Nilofer Arshad, Fatima Jehangir, Amin Arshad, Tariq Adnan, Muzammil Murtaza
Medilink Consultant Clinics, Karachi, Pakistan.
DOI: https://doi.org/10.36283/PJMD12-1/007
How to cite: Arshad N, Jehangir F, Arshad A, Adnan T, Murtaza M. Under Five Girls Found More Prone to Protein Energy Malnutrition Compared to Boys: A Squatter Settlement Study from Karachi. Pak J Med Dent. 2023;12(1): 30-37. doi: 10.36283/PJMD12-1/007
Background: Protein-energy malnutrition (PEM), is an imbalance between protein and energy intake and the body’s requirement for optimal growth. In Pakistan, almost 40% of children, less than 5 years, have stunted growth, while 17.7% suffer from muscle wasting. This study aimed to explore the frequency of the different types of protein energy malnutrition in children under 5 years residing in Sikandarabad and evaluate the risk factors leading to this condition.
Methods: This cross-sectional observational study, recruited 220 children less than 5 years of age. Previous health record was investigated. Physical examination was done and anthropometric measurements of each child were plotted on WHO/CDC Growth Standard Charts to classify the degree of protein energy malnutrition. Binary and multivariate logistic regression was computed to see a significant association with the outcome.
Results: The prevalence of PEM was 136(61.5%). Overall girls were underweight (9±3.8 kg) and stunted (77.2±16.1) compared to boys. Delayed weaning was a significant risk factor for PEM (p=0.044). The majority of children belonged to Low socio-economic status 65(47.8%), with more than 2 siblings. However, 40(29.4%) of those below 5 years were malnourished. A positive association (OR:1.37,1.21) was found between PEM and acute illnesses (56.6%), worm infestation (14%) and measles outbreaks (5.9%).
Conclusion: Young girls (9±3.8 kg) were found severely undernourished compared to boys. This is probably because of bias attitude toward gender preference in the distribution of quality food (p=0.14).
Keywords: Protein Energy Malnutrition; Underweight; Stunting; Wasting; Overweight.
Protein-energy malnutrition (PEM) is the consequence of either inadequate calorie intake or inadequate calorie utilization due to absorption defects or infections1. Usually, the two conditions, the poor intake and the poor utilization of calories by the body co-exist and/or become a vicious cycle, for example, chronic infections can lead to poor intake which leads to lowered immunity resulting in an increased disposition to infections2. PEM is characterized by low body cell mass and inappropriate growth. PEM is divided into three types based on the clinical presentation and source of calorie deprivation or type of calorie imbalance. The three types of PEM are Marasmus, Kwashiorkor and Marasmic Kwashiorkor. These types are further categorized as mild, moderate and severe based upon expected weight percentage for length using international standards3.
Marasmus is the most common form in developing countries due to nutritional deficits resulting in body muscle and fat loss. The marasmic child has weight loss and is hungry while Kwashiorkor is characterized by weight loss with edema secondary to protein deficiency, enlarged fatty liver and apathy. Marasmic kwashiorkor is a mix of the two previously mentioned conditions4. PEM is also sometimes referred to as wasting or starvation instead of Marasmus if it is secondary to calorie deprivation. On the other hand, if PEM is due to poor utilization of calorie intake it is referred to as ‘Kwashiorkor’ or hypermetabolism, such as in case of inflammation5. The distinction between the two types of PEM is very important in terms of nutritional therapy to avoid undernutrition and/or overnutrition and subsequent complications.
The World Health Organization (WHO) defines protein energy malnutrition (PEM) as a disparity between the intake of protein and calories and the body’s requirement of them to facilitate optimal development and function of the body6. It occurs particularly in children less than five years of age as this is the period of most rapid growth so their protein and energy requirement per kilogram body weight is the highest. This condition primarily affects preschool children of ages less than 5 years with dreadful aftereffects that may extend to leave these children with an inability to achieve proper physical and cognitive growth and may also make them susceptible to infections. Disturbance to the child’s development at this age can cause permanent disability later in life7.
Several risk factors have been associated with malnutrition of children under 5 years of age, a few of which include a poor diet, unsanitary living conditions, and a high rate of illiteracy amongst women. On further analysis these risk factors may be further linked to various other conditions present in society; for example, an inadequate diet may be a product of low per capita income or due to a delay in the introduction of weaning food; unsanitary living conditions can be explained by a high population density along with an absence of drinkable water and a lack of sewage disposal facilities; and the illiteracy of women can be a consequence of traditional customs in society8. These risk factors often present themselves in clusters and interrelate to produce synergistic effects9.
According to WHO there are 47 million children under the age of 5 years who are wasted, 14.3 million children are severely wasted and 144 million are stunted and 38.3 million children are overweight or obese10. In Pakistan, within the age group of fewer than 5 years, four out of ten children are stunted while 17.7% suffer from wasting. The double burden of malnutrition is becoming progressively evident, with approximately one in three children underweight (28.9%) alongside a high prevalence of overweight (9.5) in the same age group6. Malnourished children, especially those with severe acute malnutrition, possess a greater risk of death from ordinary childhood illnesses such as diarrhea, pneumonia and malaria. Factors associated with nutrition contribute to about 45% of deaths in children under the age of five 5. Therefore, this study aimed to explore the frequency of the different types of protein energy malnutrition in children under 5 years residing in Sikandarabad and diversify the risk factors leading to this condition.
A cross-sectional observational study was conducted in the year 2021 in Sikandarabad, which is an urban squatter settlement located in the neighborhood of Kemari Town in Karachi. The study was approved by the ethics review committee of the organization. ERC code# 4020721NAFM. The children n=220 of both sexes with ages ranging from 0-59 months who were coming to the pediatrics and family medicine clinics were randomly selected for the study. Any child suffering from a chronic disease like tuberculosis (TB), malignancy, congenital malformations, heart disease, kidney disease, diabetes, neuromuscular disorders, thyroid disorder or other endocrine disorder were excluded from the study. The doctor asked the mother of the child questions and filled out a pre-designed questionnaire to collect information about the birth, diet and health of the child as well as general questions related to the living conditions, economics and educational level of the parents.
Physical examination of the child was conducted by the physician to include weight and height of all the children while mid-upper arm circumference (MUAC) of only children 6-59 months. Children aged from birth to 24 months were weighed on the electronic baby weighing scale and their length was measured by the infant meter. Older children were weighed on the flat weighing scale and their height was measured on the upright stand. MUAC of the left arm was measured with a flexible tape measure. Scales were read to the nearest 0.1kg and 1.0cm. The WHO Growth Standards were used for children aged 0-24 months and the CDC Growth standards for children 25-29 months, while the WHO guidelines were used for selecting the cut-offs for MUAC. Data entry was done on the IBM SPSS statistics version 20.0 and both descriptive and analytical analysis was done. Chi-square, binary and multivariate logistic regression were computed to see associations with malnutrition.
The frequency of PCM came out to be 136 (61.5%). The weight and height of male babies were insignificantly higher than females. Table 1 demonstrates the association of risk factors with malnourished and healthy kids. For those who were malnourished, most (77.9%) lived in overcrowded living conditions as compared to healthy children (69.4%) but the results were statistically insignificant (p-value=0.104). Of those who were malnourished, 13(9.6) had incomplete immunization as compared to healthy children 4(4.7%). Of those who were malnourished most 65(47.8%) were poor (earned less than Rs. 20000). Table 2 compares the anthropometric measurements in boys and girls.
Table 1: Comparison of risk factors in malnourished vs healthy children.
| Variables | Covariates | n (%) |
Malnourished children n (%) n=136 |
Healthy children n (%) n=84 |
p-Value |
| Gender | Male/Female |
112(50.7) 109(49.3) |
69(50.7) 67(49.3) |
43(50.6) 42(49.4) |
0.546 |
| Type of Delivery |
Spontaneous vaginal delivery Caesarean Section |
170(76.9)
51(23.1) |
102(75)
34(25) |
68(80)
17(20) |
0.245 |
| Number of siblings under 5 years of age |
Less than 2 siblings More than 2 siblings |
50(22.6)
171(77.4) |
40(29.4)
96(70.6) |
10(11.8)
75(88.2) |
0.001 |
| Overcrowding | Present
Absent |
162(73.3) 56(25.3) |
106(77.9) 30(22.1) |
59(69.4) 26(30.6) |
0.104 |
| Mother’s work |
Stays at home Working |
211(95.5)
10(4.5) |
131(96.3)
5(3.7) |
80(94.1)
5(5.9) |
0.326 |
| Father’s work | Unemployed
Employed |
4(1.8) 217(98) |
3(2.2) 133(100) |
1(1.2) 84(98.8) |
0.106 |
| Family income |
Rs<20k 21-50k >51k |
103(46.6) 92(41.6) 26(11.8) |
65(47.8) 54(39.7) 17(12.5) |
38(44.7) 38(44.7) 9(10.6) |
0.747 |
| Immunization status | up to date Incomplete |
192(86.9) 17(7.7) |
112(82.4) 13(9.6) |
80(94.1) 4(4.7) |
0.412 |
| Weaning time |
Early On-time Delayed |
47(21.3) 20(9) 154(69.7) |
22(16.2) 14(10.3) 100(73.5) |
25(29.4) 6(7.1) 54(63.5) |
0.026 |
Table 2: Comparison of anthropometric measurements in male vs female children.
| Anthropometric Measurements | Male n (%) n=112 | Female n (%) n=109 | p-Value |
|
Weight in kg (Mean + SD) |
10.5+9.6 | 9+3.8 | 0.14 |
|
Height in cm (Mean + SD) |
78.2+15.2 | 77.2+16.1 | 0.64 |
| Weight for age <5th centile | 52(46.4) | 53(48.6) | 0.857 |
| Height for age <5th centile | 41(36.6) | 30(27.5) | 0.484 |
| Weight for height Z score <-3 | 18(16.1) | 17(15.6) | 0.6 |
| Weight for age <-2SD | 52(46.4) | 53(48.6) | 0.424 |
| Height for age <-2SD | 40(35.7) | 31(28.4) | 0.155 |
| Weight for height <-2SD | 35(31.2) | 34(31.2) | 0.544 |
| Weight for height >+2SD | 6(5.4) | 1(0.9) | 0.064 |
Figure 1 explains the consumption of a nutrient-dense diet among malnourished and healthy children. It was clear that malnourished kids had lesser consumption of macro and micronutrients as compared to healthy kids as shown in Table 2.
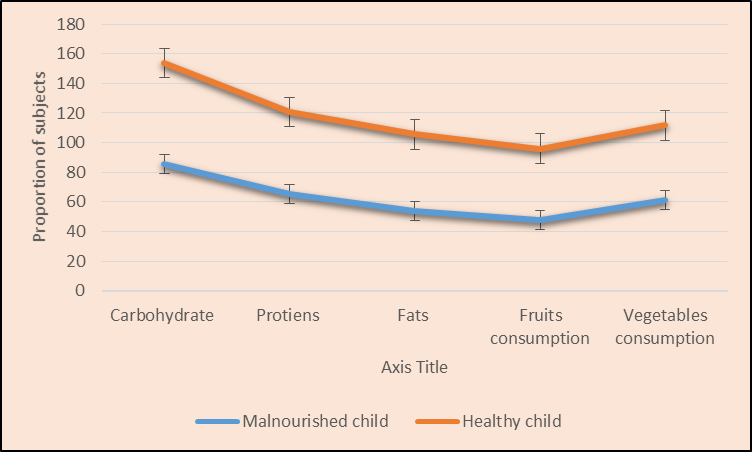
Figure 1: Comparison of nutrient-dense diet among malnourished and healthy individuals.
Figure 2 shows the association of acute illnesses with protein energy malnutrition. It was concluded that malnourished children had a higher incidence of acute illnesses, worm infestation and measles infection as shown in Table 3.
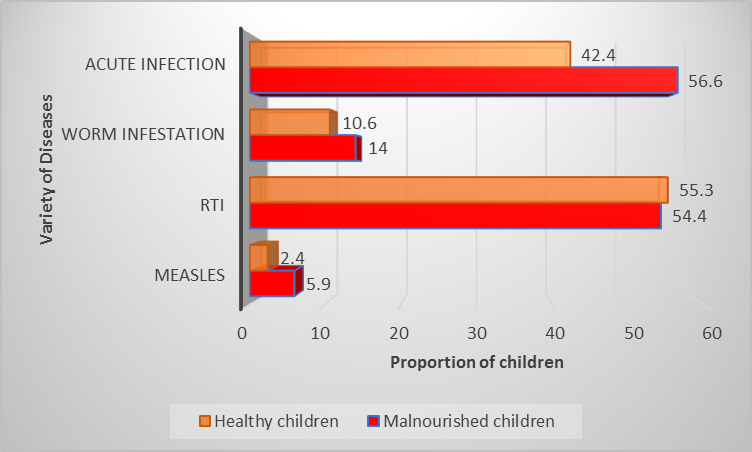
Figure 2: Comparison of disease-afflicted children vs healthy children concerning protein energy malnutrition.
Table 3: Regression analysis presented the association with outcome.
| Variables | Crude OR | CI Lower | Upper | p-Value | AOR | CI Lower | Upper | p-Value |
| More than 2 siblings under 5 years | 0.32 | 0.15 | 0.681 | 0.003 | 0.371 | 0.171 | 0.806 | 0.012 |
| Non- vaccinated | 0.854 | 0.403 | 1.809 | 0.681 | – | – | – | – |
| Illiterate mother | 1.39 | 1.059 | 1.831 | 0.018 | 1.175 | 0.847 | 1.63 | 0.334 |
| Illiterate father | 1.45 | 1.113 | 1.894 | 0.006 | 1.307 | 0.948 | 1.802 | 0.102 |
| Worm infestation | 1.371 | 0.59 | 3.189 | 0.463 | – | – | – | – |
| Not exclusively breastfed | 1.211 | 0.95 | 1.544 | 0.122 | – | – | – | – |
| Delayed weaning | 0.714 | 0.515 | 0.988 | 0.042 | 0.701 | 0.496 | 0.99 | 0.044 |
The study found that 61% of malnourished participants were higher than the national average, and this can be due to the selection of a homogenous study sample. According to WHO global data collected in the year 2020 for young children under five years of age, about 149 million children are stunted while 45 million children are wasted for their age11. UNICEF data survey of 2018 stated that in Pakistan 40% of children under the age of five years are stunted and 17.7% suffer from wasting while 28.9 % of children in this age group are underweight12. Consequences of malnutrition are also related to future poverty and chronic illness13. The incidence of this medical condition has strong ties with the socio-economic development of countries14,15. In a study done by Ahmed et al. in 2020, they concluded that children with poor wealth quantile had the highest rate of malnutrition3. In an identical study, Garcia et al. examined socioeconomic inequalities and malnutrition in Colombian children where they concluded that the poorest households were five times more likely to be malnourished as compared to others16. It will be interesting to examine if the rate of malnutrition changes with socioeconomic development in a society.
A study carried out by Wu et al. in 2015 explored the relationship between the socioeconomic development of society and malnutrition in younger children in China from 1990 to 2010 17. They reported a negative correlation between Gross Domestic Product (GDP) per capita increase and stunting or malnutrition cases in society. Effects of malnutrition do not remain limited to childhood but progress into adulthood, as stunting is a precursor of overall poor development characterized by poverty and chronic illness13. Good nutrition decreases the psychological and healthcare burden on the societies of these countries13,18. Despite the Universal Declaration of Human Rights 1948, when the WHO declared adequate food to be a human right, developing countries are still facing a growing challenge of malnutrition19,20.
Maternal knowledge of nutrition rather than their formal education is found to have the biggest impact on child malnutrition, while the father’s formal education level has a direct negative relationship to the odds of malnourishment in a child21. According to Fotso, the rural and urban differences in malnutrition have narrowed primarily due to the increasing number of urban poor populations leading to urban malnutrition in recent years22.
Our study showed more female children vs. males had malnutrition but we did not take into account the number of male and female participants or gender ratio in our study. Interestingly female gender is seen in general as at risk to develop malnutrition but scientific data reflects contrary findings. A cross-sectional study conducted by Jawaregowda and Angadi in 2015 across ten villages in India found a significant association of gender with malnourishment. They concluded that 40.1% of male children and 36.7% of female children were malnourished in their study group, they used WHO growth Charts to measure malnutrition23. Similar results were summed up by Thurstans et al. in a systemic review of 44 studies. They evaluated the sex difference in malnutrition over a wide geographical region of the world. They concluded that there is a female advantage factor and that boys are found to be more vulnerable, but the gender difference plays a weaker role in South Asia as compared to other parts of the world24.
We also observed that having two or more siblings under five years of age predisposes a child to malnutrition. A cross-sectional analysis across three countries of South Asia by Raj et al. concluded that the higher birth order increases the risk of malnutrition and that a female child is affected more than a higher birth-order male child25. Culturally more siblings in the family indicate a desire for a male child and hence a preferential treatment for them26.
High cases of fatalities due to malnutrition adds up to the psychosocial burden of society27. Every day, millions of people fight against hunger worldwide according to the Global Report on Food Crises28. According to the WHO, the years 2016-2025 are proclaimed as the Decade of Action on Nutrition to overcome all forms of malnutrition and to meet global nutrition targets and diet-related issues globally29. This goal can be achieved in Pakistan by following WHO policies and empowering nutritional governance and accountability30. The limitations of our study were, recall bias as we depend on the mother’s memory to answer the questionnaire. We choose a homogenous sample to study and did not classify various levels of malnutrition or separated the data based on gender or specify the gender of siblings in the household.
In this study, 61% of the children had PCM. Important predisposing factors found in this study were female gender, low socioeconomic condition of the family, and birth order or having multiple younger siblings, especially under 5 years of age. These participants are found to be consuming a less nutrient-dense diet with an increased incidence of acute illness, particularly infectious diseases like Measles, and higher incidences of worm infestation. Poor health access and nutritional deficiencies have been the primary reason for protein-energy malnutrition in Sikandarabad. Lack of maternal knowledge of nutrition and food selection is seen to be a very important factor as well as awareness when reaching out to seek medical help if needed. Also, a large number of children in a household significantly increases the burden on the families to provide food and close attention to their young children’s health needs. Basic awareness among parents regarding balanced nutrition, widespread vaccination drives, and population control education can prevent malnutrition and will reduce the burden on society and improve the health economy.
The authors appreciate the cooperation of their professors and senior colleagues for their guidance.
There was no conflict of interest among the authors.
The study was approved by the ethics review committee of the organization (ERC code# 4020721NAFM).
Written consent was taken from the parents of all participants. Anybody who wished to drop in the middle of the study was allowed to do so.
NA, FJ and AA were involved in conceiving the idea, benchwork and writing the manuscript. FJ did the statistical analysis. TA and MM worked on manuscript writing and proofreading.
- De Onis M, Monteiro C, Akré J, Glugston G. The worldwide magnitude of protein-energy malnutrition: an overview from the WHO Global Database on Child Growth. Bull World Health Organ. 1993;71(6):703-712.
- Zuckerberg AL, Lefton-Greif MA. Nutrition and Metabolism in the Critically Ill Child with Cardiac Disease. In Critical Heart Disease in Infants and Children 2006 (pp. 379-403). Elsevier Inc. doi: 10.1016/B978-032301281-2.50017-5
- Ahmed T, Hossain MI, Islam M, Ahmed AS, Afroze F, Chisti MJ. Protein-energy malnutrition in children. In Hunter’s tropical medicine and emerging infectious diseases 2020 (pp. 1034-1041). Elsevier. doi : 10.1016/B978-0-323-55512-8.00143-5
- Gangadharan A, Choi SE, Hassan A, Ayoub NM, Durante G, Balwani S, et al. Protein calorie malnutrition, nutritional intervention and personalized cancer care. Oncotarget. 2017; 8(14): 24009-24030. doi: 10.18632/oncotarget.15103
- Schaible UE, Kaufmann SH. Malnutrition and infection: complex mechanisms and global impacts. PLoS Med. 2007;4(5):0806-0812. doi:10.1371/journal.pmed.0040115
- De Onis M, Blössner M. WHO global database on child growth and malnutrition. Geneva: World Health Organization. 1997:1-67. Available from: https://citeseerx.ist.psu.edu/document?repid=rep1&type=pdf&doi=97232c7bba5bef3ac970bf82966a8ea97cb4fa14
- Gragnolati M, Shekar M, Das Gupta M, Bredenkamp C, Lee YK. India’s undernourished children: a call for reform and action. Open Knowledge Repository. 2005:1-116. Available from: https://openknowledge.worldbank.org/bitstream/handle/10986/13644/346380IN0UndernourishedChildren01PUBLIC1.pdf?sequence=1&isAllowed=y
- Grosse RN. Interrelation between health and population: observations derived from field experiences. Soc Sci Med C. 1980;14(2):99-120. doi: 10.1016/0160-7995(80)90030-1
- Katona P, Katona-Apte J. The interaction between nutrition and infection. Clin Infect Dis. 2008;46(10):1582-1588. doi: 10.1086/587658
- World Health Organization (WHO). Available from: https://www.who.int/news-room/fact-sheets/detail/malnutrition
- Dewey KG, Mayers DR. Early child growth: how do nutrition and infection interact? Matern Child Nutr. 2011;7:129-142. doi: 10.1111/j.1740-8709.2011.00357.x
- National Nutrition Survey. UNICEF 2018. Available from: https://www.unicef.org/pakistan/media/1951/file/Final%20Key%20Findings%20Report%202019.pdf
- Rahman A, Chowdhury S. Determinants of chronic malnutrition among preschool children in Bangladesh. J Biosoc Sci. 2007;39(2):161-173. doi: 10.1017/S0021932006001295
- Galgamuwa LS, Iddawela D, Dharmaratne SD, Galgamuwa GL. Nutritional status and correlated socio-economic factors among preschool and school children in plantation communities, Sri Lanka. BMC Public Health. 2017;17(1):1-11. doi: 10.1186/s12889-017-4311-y
- Ahmad D, Afzal M, Imtiaz A. Effect of socioeconomic factors on malnutrition among children in Pakistan. Futur Bus J. 2020;6(1):1-11. doi: 10.1186/s43093-020-00032-x
- Garcia S, Sarmiento OL, Forde I, Velasco T. Socio-economic inequalities in malnutrition among children and adolescents in Colombia: the role of individual-, household-and community-level characteristics. Public Health Nutr. 2013;16(9):1703-1718. doi: 10.1017/S1368980012004090
- Wu L, Yang Z, Yin SA, Zhu M, Gao H. The relationship between socioeconomic development and malnutrition in children younger than 5 years in China during the period 1990 to 2010. Asia Pac J Clin Nutr. 2015;24(4):665-673.
- Beal T, Tumilowicz A, Sutrisna A, Izwardy D, Neufeld LM. A review of child stunting determinants in Indonesia. Matern Child Nutr. 2018;14(4):1-10. doi: 10.1111/mcn.12617
- Kent G. ‘The human rights approach to reducing malnutrition’. Population and Development: Challenges and Opportunities. 2000. p. 321.
- Devi PY, Geervani P. Determinants of nutrition status of rural preschool children in Andhra Pradesh, India. Food Nutr Bull. 1994;15(4):1-8. doi: 10.1177/156482659401500402
- Jesmin A, Yamamoto SS, Malik AA, Haque MA. Prevalence and determinants of chronic malnutrition among preschool children: a cross-sectional study in Dhaka City, Bangladesh. J Health Popul Nutr. 2011; 29(5): 494-499. doi: 10.3329/jhpn.v29i5.8903
- Fotso JC. Urban–rural differentials in child malnutrition: trends and socioeconomic correlates in sub-Saharan Africa. Health Place. 2007;13(1):205-223. doi: 10.1016/j.healthplace.2006.01.004
- Jawaregowda SK, Angadi M. Gender differences in nutritional status among under five children in rural areas of Bijapur district, Karnataka, India. Int J Community Med Public Heal. 2015;2:506-509. doi: 10.18203/2394-6040.ijcmph20151038
- Thurstans S, Opondo C, Seal A, Wells J, Khara T, Dolan C, et al. Boys are more likely to be undernourished than girls: a systematic review and meta-analysis of sex differences in undernutrition. BMJ Glob Health. 2020;5(12):1-17. doi: 10.1136/bmjgh-2020-004030
- Raj A, McDougal LP, Silverman JG. Gendered effects of siblings on child malnutrition in South Asia: cross-sectional analysis of demographic and health surveys from Bangladesh, India, and Nepal. Matern Child Health J. 2015;19(1):217-226. doi: 10.1007/s10995-014-1513-0
- Mushtaq MU, Gull S, Khurshid U, Shahid U, Shad MA, Siddiqui AM. Prevalence and socio-demographic correlates of stunting and thinness among Pakistani primary school children. BMC Public Health. 2011;11(1):1-2. doi: 10.1186/1471-2458-11-790
- Popkin BM, Corvalan C, Grummer-Strawn LM. Dynamics of the double burden of malnutrition and the changing nutrition reality. Lancet. 2020;395(10217):65-74. doi: 10.1016/S0140-6736(19)32497-3
- Crisis, Global Network Against Food. “Global Report on Food Crises – 2021”, FAO: Rome, Italy, 2021. Available from: https://www.wfp.org/publications/global-report-food-crises-2021
- UN Decade of Action on Nutrition Current Status and Commitments. World Health Organization, 2018. Available from: https://cdn.who.int/media/docs/default-source/nutritionlibrary/events/decade-of-action/fpgh-workshop/fpgh-workshop-nutrition-against-ncd-16nov-presentation-fao_who.pdf?sfvrsn=4f6a1e09_5
- Country Nutrition Profiles. Nutrition Report | The global burden of malnutrition at a glance, 2020. Available from: https://globalnutritionreport.org/resources/nutrition-profiles/
This is an open-access article distributed under the terms of the CreativeCommons Attribution License (CC BY) 4.0 https://creativecommons.org/licenses/by/4.0/