By Fatima Abid1, Muhammad Irfan2, Zahid Ali3, Urooj Fatima4
AFFLIATIONS:
- Department of Physiology, Jinnah Sindh Medical University, Karachi, Pakistan.
- Department of Physiology, Bolan Medical College, Quetta, Pakistan.
- Department of Physiology, Jhalawan Medical College, Khuzdar, Pakistan.
- Department of Anatomy, Jinnah Sindh Medical University, Karachi, Pakistan.
DOI: https://doi.org/10.36283/PJMD11-4/009
ORCID iD: 0000-0001-9118-5255
How to cite: Abid F, Irfan M, Ali Z, Fatima U. Body Shape Index, Body Adiposity Index, and Body Roundness Index to Predict Cardiovascular Health Status. Pak J Med Dent. 2022;11(4): 55-60. doi: 10.36283/PJMD11-4/009
Background: Obesity and overweight, the fifth noticeable reason for worldwide mortality, has been found directly related to cardiovascular illness and sudden death. This study aimed to evaluate anthropometric measurements including; a Body Shape Index (ABSI), Waist-Height Ratio (WHtR), Abdominal Volume Index (AVI) and Conicity Index (CI), the risk factors for cardiovascular diseases.
Methods: This case-control study was conducted at BMSI, Jinnah Post Graduate Hospital from March 2019 to September 2020. Participants selected (n=105 adults, aged 30-50 years) were divided into three groups (35 each). Group A: patients with diabetes <5 years without microalbuminuria, Group B: patients > 5 years of diabetes with microalbuminuria and Group C: healthy individuals. All measurements were estimated twice. Data was analyzed by SPSS and the mean difference was found by ANOVA. Linear regression was applied to predict variables and p<0.05 was considered significant.
Results: The body mass index (BMI) among Group A, B and C was 25.1±0.04 kg/m2, 26.4±1.91 kg/m2 and 23.7±1.9 kg/m2 respectively. Statistically significant (p=0.000) mean difference for weight, BMI, WHtR, AVI and CI were observed among groups. A highly strong negative relationship between BMI with RPI and strong positive relationship of WHtR with AVI (r=0.887), BAI(r=0.929), CI(r=0.890), WWI(r=0.870), was found. However, highly strong positive relationship between ABSI with WWI and CI with WWI, was also observed.
Conclusion: Predictors found related to cardiovascular health were BRI, BAI, and ABSI (p=0.000). However, neither the BRI, ABSI nor BAI showed superior predictive power to WC, BMI, CI, WHtR and Conicity index.
Keywords: Cardiovascular Abnormalities; Body Mass Index; Waist-Height Ratio (WHtR); Waist-Hip Ratio.
Obesity and overweight are the fifth noticeable reason for worldwide demise and are an expanding overall medical issue. In 2008, about 1400 million adults had been reported overweight while approximately 36% were fatty1. Obesity and overweight relate to an expanded danger of cardiovascular illnesses, Type 2 Diabetes mellitus, and sudden death2-3. Subsequently, recognition of obesity and overweight timely can prevent irreversible diseases like cardiovascular disease (CVD)4. In recent guidelines, Waist Circumference (WC) and Body Mass Index (BMI) is the utmost essential tool to detect obesity and overweight5,6. To be sure, an escalation in WC or BMI was demonstrated as the utmost risk to induce CVD 6. In any case, past studies additionally exhibited that the differentiated limit of BMI is ideally not to be considered, and this could not recognize fat and appropriate weight7. WC has been demonstrated to be a decent indicator of abdominal fat, yet presently it is hazy how much the scope of WC relies upon body size8,9. This has prompted the possibility that joining customary procedures (for example stature, weight, BMI, or WC) can predict a considerable amount of body shape10,11. ABSI (A Body Shape Index), also depends on abdomen periphery (m), BMI (kg/m2), and tallness (m) 11. As indicated by the creators, an elevated ABSI connects with a more noteworthy part of abdominal fat and, by all accounts, is a great danger factor for sudden passing12. Different examinations have recommended that ABSI can anticipate the progression of diabetes mellitus.
A few investigations have projected that WHtR, can be a most excellent anthropometric boundary for predicting cardio-metabolic disease13. Be that as it may, it is not generally the best boundary. A few studies have displayed that WC was further connected with CHD and this is the key factor in Caucasians12,13. As of late, a few latest anthropometric boundaries have been projected. The abdominal volume index (AVI) is determined by utilizing the midsection boundary and hip, and one review has shown that it was a decent anthropometric device for assessing general abdominal volume13. The body adiposity index (BAI) is a complex term that depends on hip circumference and stature. It is separate from instinctive adiposity and generally, it can view as an upper limit of body adiposity. Notwithstanding, a few papers have revealed that BAI would not be considered to calculate adiposity. Importantly, BRI is one more complex measurement tool that depends upon WC and tallness. One paper has revealed that BRI can predict the early phase of CVD and a body shape index (ABSI) another tool to calculate adiposity and depend upon the abdominal, its periphery, BMI, and stature. Studies have displayed that ABSI is interconnected with hypertension and DM14,15. The Current study aimed to evaluate which anthropometric measurements among CHD patients can be utilized by specialists as early anthropometric risk factors.
This case-control study was conducted at BMSI Jinnah Post Graduate Hospital from March 2019 to September 2020. A total of 105 adults who visited the diabetic clinic JPMC between the ages of 30-50 years were selected by non-probability purposive sampling. This study was approved by the institutional ethics review board. The consent of the patients was taken before adding them to the study. Participants were divided into three equal groups (35 patients in each group). Group A includes patients with diabetes less than or equal to 5 years without microalbuminuria, Group B includes patients with more than 5 years of diabetes with microalbuminuria and Group C includes healthy individuals. Variables were measured and data was collected by the researcher himself as per a predefined questionnaire-taking interview.
The questionnaire included socio-demographic variables, clinical and biophysical variables about smoking and its complete history. The Blood Pressure was estimated 3 times for every 10-min period by using a regular sphygmomanometer (HEM-907; Omron). Weight, stature, WC, and hip circumference were estimated by a normalized conventional method, by wearing light garments with no shoes. All measurements were estimated two times and on the off chance that the actions varied by > 0.5 cm or > 0.5 kg, individually, a 3rd estimation was taken finally. The normal of the 2 nearest estimations was taken in the examination. Approximately, 10hours of night fasting, serum glucose and lipid profile levels were estimated before breakfast utilizing a Vacutainer tube containing EDTA.
The Framingham hazard score was used which is a basic and universal tool that can assess levels of CAD for a single decade10. The FRS includes 6 coronary lethal factors that include age, sex, smoking habits SBP, TC, and HDL16. The ABSI was determined utilizing the recipe portrayed by Krakauer et al17. AVI was determined utilizing the accompanying recipe: AVI = [2 × (abdomen) 2 + 0.7 cm (midsection hip) 2]/1000. Hypertension was characterized as an SBP >140 mmHg, or potentially DBP > 90 mmHg, as indicated by the JNC-7 rules18,19. Diabetes mellitus is analyzed by utilizing WHO rules, FPG >126 mg/dl as well as being managed by taking anti-diabetic drugs20. Dyslipidemia was characterized as utilizing antidyslipidemic medicine or possessing at least one of the accompanying estimations: TG >1.7 mmol/L, TC > 5.2 mmol/L, HDL-C < 1.0 mmol/L and LDL-C > 3.4 mmol/L21.
Data was entered and analyzed by IBM SPSS v26. Mean and Standard deviation was calculated for quantitative data. The mean comparison was done by one-way ANOVA. For determining the relationship of quantitative variables, Pearson’s coefficient of correlation was applied. Linear regression was applied to make models for the prediction of quantitative variables. Variables. A p-value of less than 0.05 was considered significant.
The mean body mass index of n=105 was 25.1±0.04 kg/m2, 26.4±1.91 kg/m2 and 23.7±1.9 kg/m2 among Group A, Group B and Group C respectively. The present study found significant mean difference for weight (p=0.000), BMI (p=0.000), WHtR (p=0.012), AVI (p=0.001) and CI (p=0.001) as shown in Table 1.
Table 1: Comparison of anthropometric measurements among the groups.
| Variables | Group A
Mean± SD |
Group B
Mean± SD |
Group C
Mean± SD |
p-Value |
| Weight (Kg) | 78.17±5.96 | 83.80±6.91 | 70.8±4.5 | 0.000* |
| Height (m) | 5.7±0.22 | 5.8±0.26 | 5.6±.02 | 0.130 |
| BMI (kg/m2) | 25.1±0.04 | 26.4±1.91 | 23.7±1.9 | 0.000* |
| WHtR | 0.54±0.04 | 0.56±0.05 | 0.53±0.04 | 0.012* |
| WHpR | 0.90±0.01 | 0.90±0.01 | 0.90±0.01 | 0.194 |
| AVI | 18.5±3.6 | 20.6±4.0 | 17.3±0.0 | 0.001* |
| BAI | 26.9±3.5 | 28.6±4.2 | 26.8±4.2 | 0.107 |
| ABSI | 0.084±0.007 | 0.085±0.007 | 0.085±0.007 | 0.690 |
| CI | 11.15±1.06 | 11.69±1.1 | 10.7±0.92 | 0.001* |
| WWI | 10.8±0.88 | 11.02±0.90 | 10.9±0.80 | 0.519 |
WHtR; waist to height ratio, WHpR =waist to hip ratio, AVI; abdominal volume index BAI; body adiposity index, ABSI; a body shape index, CI; Conicity Index, WWI; weight adjusted waist index, ANOVA was applied. *Significant at 0.05 level.
The present study found a highly strong negative relationship between BMI with RPI(r=-0.910) while there was also a high strong positive relationship between WHtR with AVI(r=0.887), BAI(r=0.929), CI(r=0.890), WWI(r=0.870). The study also observed a highly strong positive relationship between ABSI with WWI(r=0.866) and CI with WWI(r=0.860) as shown in Table 2.
Table 2: Relationship among anthropometric measurements.
| Variables | BMI | WHtR | WHpR | AVI | BAI | ABSI | CI | WWI | RPI | |
| BMI | r | 1 | ||||||||
| p-Value | ||||||||||
| WHtR | r | .500** | 1 | |||||||
| p-Value | 0.000 | |||||||||
| WHR | r | -0.037 | .397** | 1 | ||||||
| p-Value | 0.709 | 0.000 | ||||||||
| AVI | r | .287** | .887** | .397** | 1 | |||||
| p-Value | 0.003 | 0.000 | 0.000 | |||||||
| BAI | r | .607** | .929** | 0.167 | .702** | 1 | ||||
| p-Value | 0.000 | 0.000 | 0.091 | 0.000 | ||||||
| ABSI | r | -.239* | .629** | .442** | .765** | .433** | 1 | |||
| p-Value | 0.015 | 0.000 | 0.000 | 0.000 | 0.000 | |||||
| CI | r | .300** | .890** | .333** | .995** | .721** | .756** | 1 | ||
| p-Value | 0.002 | 0.000 | 0.001 | 0.000 | 0.000 | 0.000 | ||||
| WWI | r | 0.009 | .870** | .487** | .863** | .728** | .866** | .860** | 1 | |
| p-Value | 0.931 | 0.000 | 0.000 | 0.000 | 0.000 | 0.000 | 0.000 | |||
| RPI | r | -.910** | -.377** | 0.087 | -0.041 | -.581** | .375** | -0.053 | 0.084 | 1 |
| p-Value | 0.000 | 0.000 | 0.385 | 0.679 | 0.000 | 0.000 | 0.598 | 0.402 | ||
WHtR; waist to height ratio, WHpR=waist to hip ratio, AVI; abdominal volume index, BAI; body adiposity index, ABSI; a body shape index, CI; Conicity Index, WWI; weight adjusted waist index, RPI; reciprocal ponderal index, Pearson Coefficient of Correlation was applied. **Correlation is significant at the 0.01 level (2-tailed) *Correlation is significant at the 0.05 level (2-tailed).
Prediction of different anthropometric measures was done by linear regression as shown in Figure 1 and detailed equations are presented in Table 3.
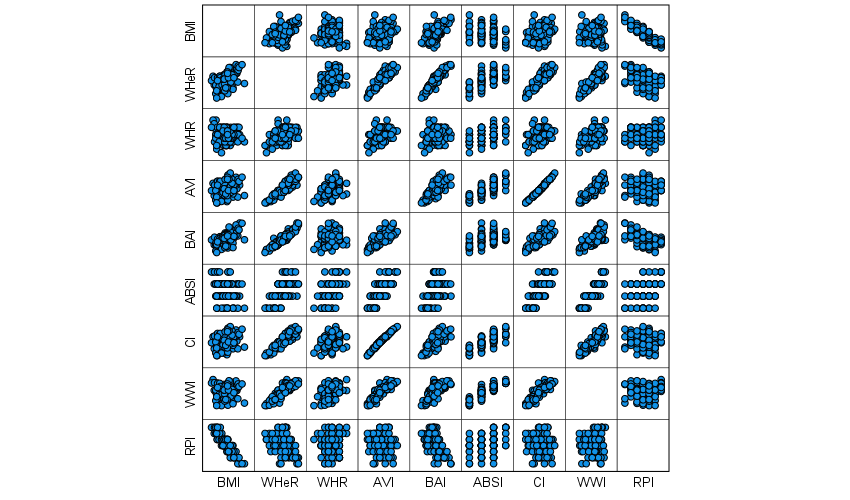
Figure 1: Scatter diagram for anthropometric measurements.
WHtR; waist to height ratio, WHpR=waist to hip ratio, AVI; abdominal volume index BAI; body adiposity index, ABSI; a body shape index, CI; Conicity Index, WWI; weight adjusted waist index.
Table 3: Regression equation for anthropometric measurements.
| Model | Regression Equation | Adjusted R2 |
| Model 1 | BMI=15.787+0.340(BAI) | 0.362 |
| Model 2 | BAI=-2.606+2.686 (Conicity Index) | 0.515 |
| Model 3 | BAI=13.370+0.749(AVI) | 0.488 |
| Model 4 | BAI=-11.979+71.933WHeR | 0.862 |
| Model 5 | AVI=-16.940+65.203WHeR | 0.785 |
| Model 6 | AVI=-16.698+418.320 (ABSI) | 0.580 |
| Model 7 | AVI=-19.673+3.434 Conicity Index | 0.990 |
WHtR; waist to height ratio, WHpR=waist to hip ratio, AVI; abdominal volume index, BAI; body adiposity index, ABSI; a body shape index, CI; Conicity Index, WWI; weight adjusted waist index.
This case-control study linked new body indices (BAI, BRI, and ABSI) with other anthropometric indices for their functionality and effectiveness in identifying diabetic patients who were at a higher risk. The results of this study revealed that. All the anthropometric indices measured in the study have a significant connection. It reflects that BAI, BRI, and ABSI can also be used to screen the cardiovascular health of patients with diabetes. However, BAI, BRI, and ABSI were found not superior to the WC, BMI, WHtR, CI and AVI. It demonstrates that new body indices ABSI is a good alternative to BMI and can identify the risk of obesity. However, it is not suitable for identifying cardiovascular disorders among patients with diabetes. On the other hand, BRI and BAI demonstrated capabilities like AVI, BMI, CI, WC, and WHtR.
It is demonstrated in a study by Krakauer et al. ABSI was found to be independent of weight height, and BMI17. It is also reported that ABSI can be extrapolative for early cardiovascular risk than each WC or BMI21. It is evaluated in another study by Bertoli et al. that ABSI was found as a readily computed age and gender-sensitive indicator of cardiovascular risk across categories of BMI22. ABSI also has the potential to be used to correlate with lifestyle causes such as diet, smoking, and physical activity. However, a study Gomez-Peralta et al. reported that ABSI found not an appropriate index to detect either CVD risk causes or CVD23. In another prospective study, it has been found that BMI, WC, and ABSI, had similar predictive capabilities for novel inception of diabetes mellitus after assessing ten years of follow-up data24. It suggests that ABSI is not early and better than BMI or WC for forecasting diabetes and the risk of cardiovascular.
Consistent with the findings of Chang et al. the present study evaluated that after adjusting age, weight, height, and smoking status, ABSI demonstrated the weakest analytical ability for cardiovascular health25. Status related to other body measurement indices. It is supported by a study that ABSI was primarily developed to identify mortality risks within a follow-up study. However, the present study used ABSI in a case-control study, which may be one of the major reasons why the ABSI was unsuccessful to show superior indicative abilities to other anthropometric indices26. As suggested by the study of Nkwana et al. the chief reason for discrepancies in results was subject physiognomy. During the direct interviews done in the present case-control study, participants with a modern lifestyle tend to have low bodily health equated to participants with a traditional lifestyle that leads them towards the development of diabetes and risk of cardiovascular disorder27.
A study Bennasar-Veny et al. indicated that BAI was designed to estimate the correlation between adiposity and metabolic disorder, diabetes, and cardiovascular morbidity28. However, the findings were unclear because of the delusive relationship between fat distribution and mass. Meanwhile, the study findings of Lam et al. reported that BAI was considered a potential and effective indicator for predicting metabolic disease and obesity risks29. In a study by Tripolino et al., it is indicated that BAI has the potential to predict cardiovascular health based on measuring body fat percentage30. It is suggested that further studies are required to be conducted that evaluate the strengths and weaknesses of new anthropometric indices, including ABSI, BRI, and BAI.
This case-control study demonstrated that BRI, BAI, and ABSI were found to be significant for predicting cardiovascular health. However, neither the BRI, ABSI nor BAI showed superior predictive power to WC, BMI, CI, WHtR, Conicity index, etc. The BRI and BAI can be used as alternative body indices for assessing cardiovascular health status. However, the ABSI demonstrated the weakest indicative capability for assessing cardiovascular health.
The authors would like to acknowledge the hospital administrative staff for their assistance in the research study.
The authors declared no conflict of interest.
This study has been approved by the institutional ethics review board.
The consent of the patients was taken before adding them to the study.
All authors contributed equally in this research study.
- World Health Organization. Obesity and overweight: fact sheet no 311. Geneva: World Health Organization; 2013. Available from: http://www. who. int/mediacentre/factsheets/fs311/en/. 2012.
- Hubert HB, Feinleib M, McNamara PM, Castelli WP. Obesity as an independent risk factor for cardiovascular disease: a 26-year follow-up of participants in the Framingham Heart Study. Circulation. 1983;67(5):968-977. doi: 10.1161/01.CIR.67.5.968
- Must A, Spadano J, Coakley EH, Field AE, Colditz G, Dietz WH. The disease burden associated with overweight and obesity. J Am Med Assoc. 1999;282(16):1523-1529. doi: 10.1001/jama.282.16.1523
- Wilson PW, D’Agostino RB, Sullivan L, Parise H, Kannel WB. Overweight and obesity as determinants of cardiovascular risk: the Framingham experience. Arch Intern Med. 2002;162(16):1867-1872. doi: 10.1001/archinte.162.16.1867
- Van Gaal LF, Mertens IL, De Block CE. Mechanisms linking obesity with cardiovascular disease. Nature. 2006;444(7121):875-880. doi: 10.1038/nature05487
- Kahn SE, Hull RL, Utzschneider KM. Mechanisms linking obesity to insulin resistance and type 2 diabetes. Nature. 2006;444(7121):840-846. doi: 10.1038/nature05482
- Tuomilehto J, Lindström J, Eriksson JG, Valle TT, Hämäläinen H, Ilanne-Parikka P, et al. Prevention of type 2 diabetes mellitus by changes in lifestyle among subjects with impaired glucose tolerance. N Engl J Med. 2001;344(18):1343-1350. doi: 10.1056/NEJM200105033441801
- Flegal KM, Kit BK, Orpana H, Graubard BI. Association of all-cause mortality with overweight and obesity using standard body mass index categories: a systematic review and meta-analysis. J Am Med Assoc. 2013;309(1):71-82. doi: 10.1001/jama.2012.113905
- Adams KF, Schatzkin A, Harris TB, Kipnis V, Mouw T, Ballard-Barbash R, et al. Overweight, obesity, and mortality in a large prospective cohort of persons 50 to 71 years old. N Engl J Med. 2006;355(8):763-778. doi: 10.1056/NEJMoa055643
- World Health Organization. Obesity: preventing and managing the global epidemic; 2000. 894 p.
- Van Binsbergen JJ, Langens FN, Dapper AL, Van Halteren MM, Glijsteen R, Cleyndert GA, et al. NHG-standaard M95. NHG-standaard Obesitas. Huisarts en Wetenschap. 2010;53(11):609-625.
- Romero-Corral A, Somers VK, Sierra-Johnson J, Thomas RJ, Collazo-Clavell ML, Korinek JE, et al. Accuracy of body mass index in diagnosing obesity in the adult general population. Int J Obes. 2008;32(6):959-966. doi: 10.1038/ijo.2008.11
- Wunderlich S, Brusca J, Bai Y. Overweight and obesity among older adults: how should obesity be determined. J Obes Wt Loss Ther. 2012;2(2):1-4. doi: 10.4172/2165-7904.1000147
- Kok P, Seidell JC, Meinders AE. The value and limitations of the body mass index (BMI) in the assessment of the health risks of overweight and obesity. Ned Mag Med. 2004;148(48):2379-2382.
- Nevill AM, Stewart AD, Olds T, Holder R. Relationship between adiposity and body size reveals limitations of BMI. Am J Phy Anthropol. 2006;129(1):151-156. doi: 10.1002/ajpa.20262
- Prentice AM, Jebb SA. Beyond body mass index. Obes Rev. 2001;2(3):141-147. doi: 10.1046/j.1467-789x.2001.00031.x
- Krakauer NY, Krakauer JC. A new body shape index predicts mortality hazard independently of body mass index. PLoS One. 2012;7(7):1-10. doi: 10.1371/journal.pone.0039504
- Pouliot MC, Després JP, Lemieux S, Moorjani S, Bouchard C, Tremblay A, et al. Waist circumference and abdominal sagittal diameter: best simple anthropometric indexes of abdominal visceral adipose tissue accumulation and related cardiovascular risk in men and women. Am J Cardiol. 1994;73(7):460-468. doi: 10.1016/0002-9149(94)90676-9
- Janssen I, Heymsfield SB, Allison DB, Kotler DP, Ross R. Body mass index and waist circumference independently contribute to the prediction of nonabdominal, abdominal subcutaneous, and visceral fat. Am J Clin Nutr. 2002;75(4):683-688. doi: 10.1016/0002-9149(94)90676-9
- World Health Organization. Waist circumference and waist-hip ratio: report of a WHO expert consultation, Geneva; 2008. Available from: https://apps.who.int/iris/bitstream/handle/10665/44583/?sequence=1
- Hsieh SD, Yoshinaga H. Do people with similar waist circumference share similar health risks irrespective of height? Tohoku J Exp Med. 1999;188(1):55-60. doi: 10.1620/tjem.188.55
- Bertoli S, Leone A, Krakauer NY, Bedogni G, Vanzulli A, Redaelli VI, et al. Association of Body Shape Index (ABSI) with cardio-metabolic risk factors: A cross-sectional study of 6081 Caucasian adults. PLoS One. 2017;12(9):1-15. doi: 10.1371/journal.pone.0185013
- Gomez-Peralta F, Abreu C, Cruz-Bravo M, Alcarria E, Gutierrez-Buey G, Krakauer NY, et al. Relationship between “a body shape index (ABSI)” and body composition in obese patients with type 2 diabetes. Diabetol Metab Syndr. 2018;10(1):1-8. doi: 10.1186/s13098-018-0323-8
- He S, Chen X. Could the new body shape index predict the new onset of diabetes mellitus in the Chinese population? PLoS One. 2013;8(1):1-4. doi: 10.1371/journal.pone.0050573
- Chang Y, Guo X, Chen Y, Guo L, Li Z, Yu S, et al. A body shape index and body roundness index: two new body indices to identify diabetes mellitus among rural populations in northeast China. BMC Public Health. 2015;15(1):1-8. doi: 10.1186/s12889-015-2150-2
- Maessen MF, Eijsvogels TM, Verheggen RJ, Hopman MT, Verbeek AL, Vegt FD. Entering a new era of body indices: the feasibility of a body shape index and body roundness index to identify cardiovascular health status. PLoS One. 2014;9(9):1-8. doi: 10.1371/journal.pone.0107212
- Nkwana MR, Monyeki KD, Lebelo SL. Body roundness index, a body shape index, conicity index, and their association with nutritional status and cardiovascular risk factors in South African rural young adults. Int J Environ Res Public Health. 2021;18(1):1-13. doi: 10.3390/ijerph18010281
- Bennasar-Veny M, Lopez-Gonzalez AA, Tauler P, Cespedes ML, Vicente-Herrero T, Yañez A, et al. Body adiposity index and cardiovascular health risk factors in Caucasians: a comparison with the body mass index and others. PLoS One. 2013;8(5):1-8. doi: 10.1371/journal.pone.0063999
- Lam BC, Koh GC, Chen C, Wong MT, Fallows SJ. Comparison of body mass index (BMI), body adiposity index (BAI), waist circumference (WC), waist-to-hip ratio (WHR) and waist-to-height ratio (WHtR) as predictors of cardiovascular disease risk factors in an adult population in Singapore. PLoS One. 2015;10(4):1-15. doi: 10.1371/journal.pone.0122985
- Tripolino C, Irace C, Carallo C, Scavelli FB, Gnasso A. Body fat and blood rheology: evaluation of the association between different adiposity indices and blood viscosity. Clin Hemorheol Microcirc. 2017;65(3):241-248. DOI: 10.3233/CH-16172
This is an open-access article distributed under the terms of the CreativeCommons Attribution License (CC BY) 4.0 https://creativecommons.org/licenses/by/4.0/